The monitor can be used to display changes in individual parameters over a period of time.

Monitor Setup
| Name | Description |
|---|---|
| Parameter | The parameter can be selected using the target button. |
| Type |
|
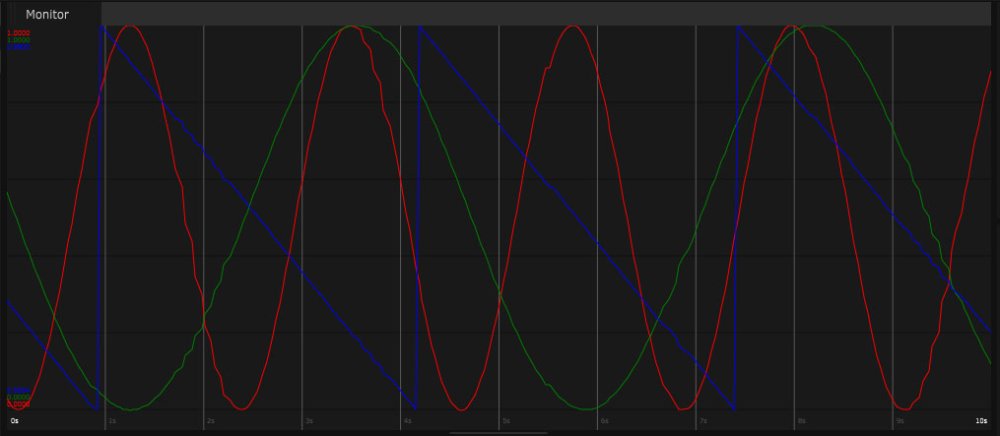
| Show Value Graph | When on the value graph of parameter changes will be displayed in the monitor window. |
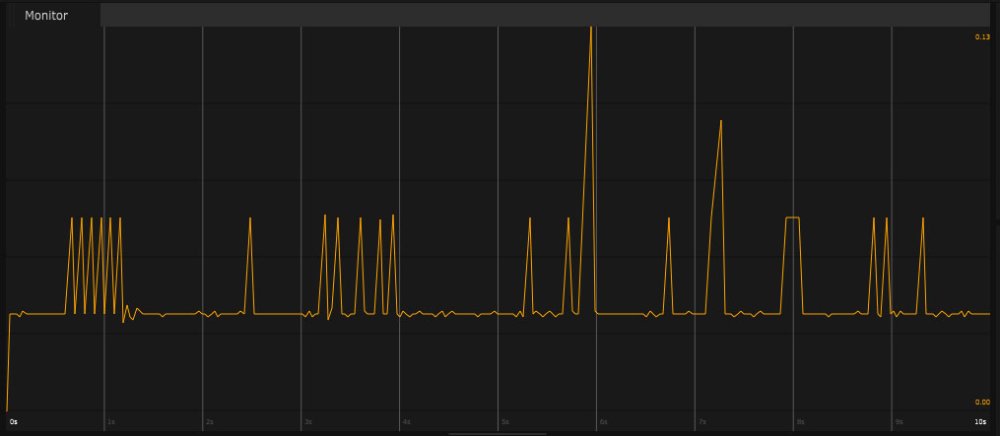
| Show Time Delta Graph | When on a graph showing the fluctuation of movement over time. |
| Show X value | When on the values from the X axis will be displayed. |
| Show Y value | When on the values from the Y axis will be displayed. |
| Show Z value | When on the values from the Z axis will be displayed. |
| Time frame duration | The duration of the monitor view can be altered here. |
| Clear | Pressing this button will clear the monitor window. |
| Save on Timeline | Pressing this button will save the movement data onto the timeline. |
| Limit data count | The maximum amount of data that can be processed by the monitor can be set. |

Graphs
When the value graph is on the XYZ parameters will be displayed in the corresponding colour to the axis (X – red, Y – green and Z – blue).
When the time delta graph is on the frequency and fluctuation and movement of the parameter.