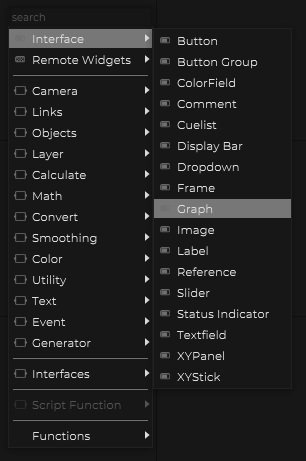
A graph is an interface object to analyse/draw float values/data.
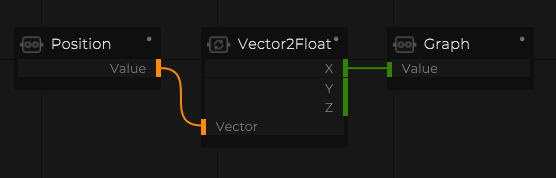
Add a Graph
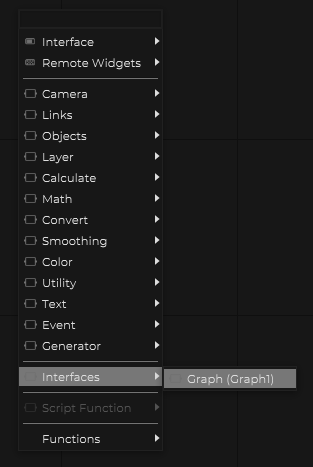
Input node for the Graph
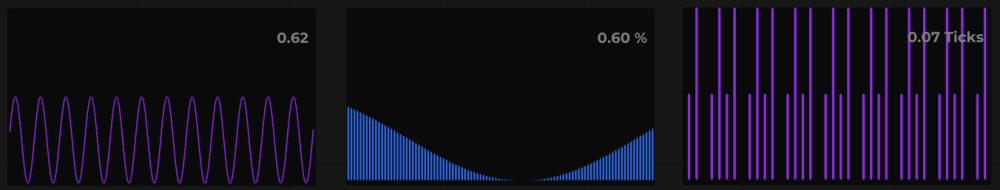
Time Based Graph
This Graph is drawing whenever the input generates changes values.
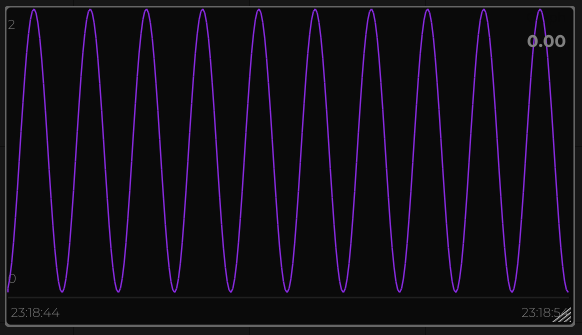
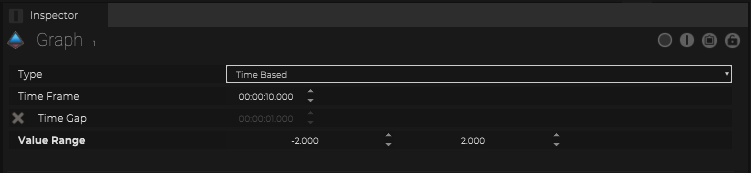
Define the total time frame and range within the inspector.
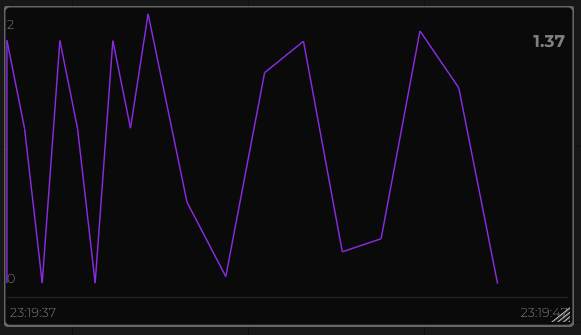
Time Based with Time Gap
With the addional option “Time Gap” the “captured” data will be only happen continuously by the defined “Time Gap”.

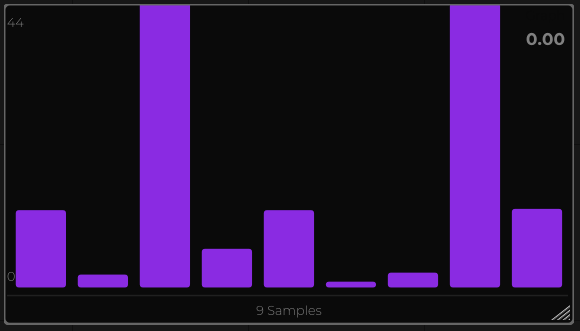
Sample Based
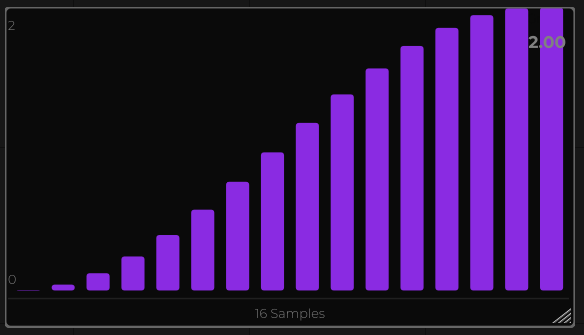
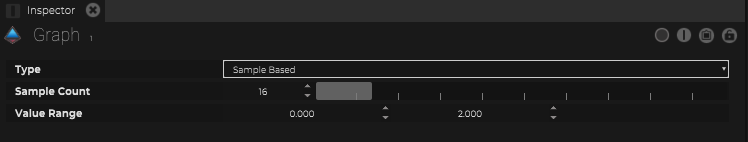
Define the max. sample count and range within the inspector.
Manual Bars
The Manual Bars mode needs to be driven with scripting.
Graph1.addEntry(value);
Graph1.clear();
Graph1.replaceEntry(index, value);
Graph1.replaceSet(values);
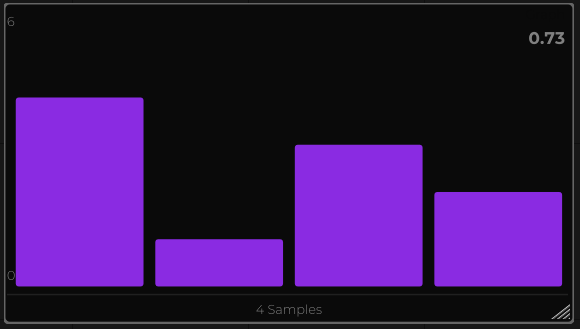
Script example 1:
Graph1.clear();
Graph1.addEntry(4);
Graph1.addEntry(1);
Graph1.addEntry(3);
Graph1.addEntry(2);
Script example 2:
Graph1.clear();
Data = [12.0, 2.0, 45.0, 6.0, 12.0, 0.9, 2.3, 44.1, 12.2];
Graph1.replaceSet(Data);